

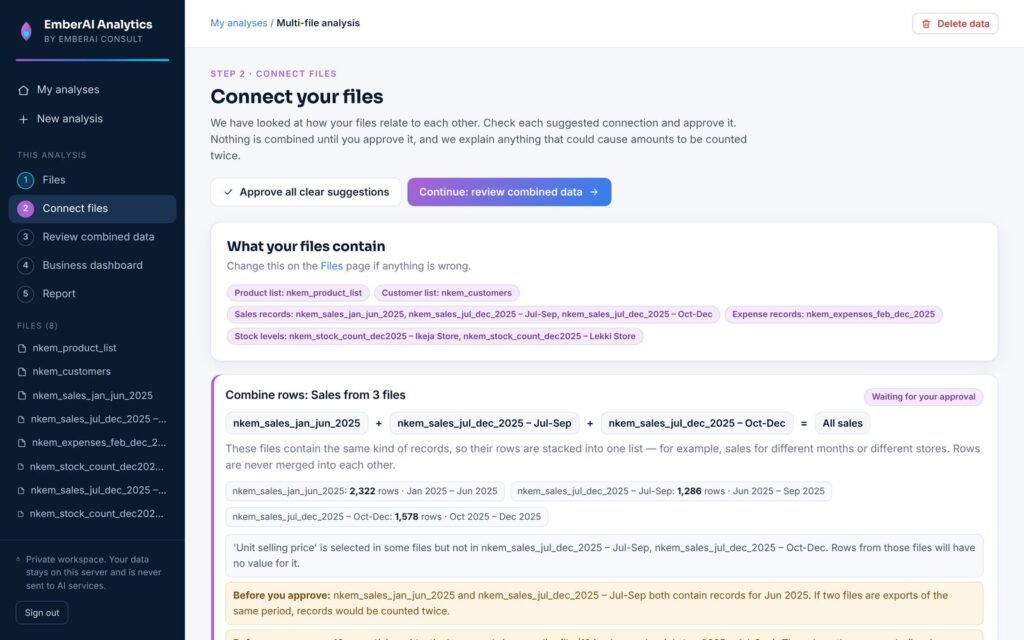
Most organisations already have the information they need to make better decisions. It is just spread across separate spreadsheets for sales, expenses and stock, with different product names, date formats and currencies. We bring those files together carefully and turn them into one dashboard and a management report written in plain English.
How your files become one report
- Your filesSales, expenses, stock, product and customer lists in Excel or CSV.
- Quality checkWe find duplicates, missing values, mixed dates and numbers stored as text.
- ConnectFiles are linked by product code, customer or month, with checks against double counting.
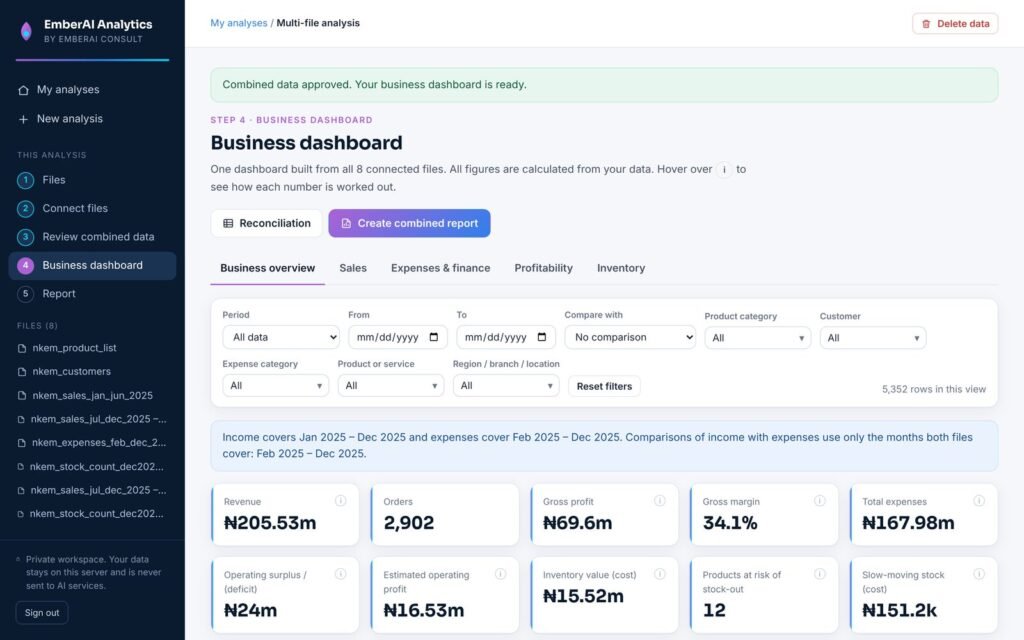
- DashboardSales, expenses, profitability and inventory in one view.
- ReportA PDF management report and an Excel workbook you can share.
What you receive
- A data-quality summary: what we found in your files and what we changed, row by row
- One combined dashboard with an overview, sales, expenses and, where your data supports it, profitability and stock
- Plain-English findings, each labelled as a fact, a possible explanation or a recommendation
- A branded PDF management report
- An Excel workbook with the analysis, charts and cleaned data
- A walkthrough call to explain the results and answer questions
An example, with fictional data
This simplified example shows the kind of overview you receive. The business and every figure in it are invented for illustration.
- Sales, Jan–Jun₦29.8m+40% from January to June
- Expenses, Jan–Jun₦21.1mTransport costs rising fastest
- Operating surplus₦8.7mEvery month in surplus
- Products at risk of running out4At recent sales rates, within 3 weeks
Show the figures as a table
| Month | Sales | Expenses | Surplus |
|---|---|---|---|
| Jan | 4,200 | 3,100 | 1,100 |
| Feb | 4,650 | 3,350 | 1,300 |
| Mar | 4,380 | 3,500 | 880 |
| Apr | 5,120 | 3,420 | 1,700 |
| May | 5,560 | 3,800 | 1,760 |
| Jun | 5,900 | 3,950 | 1,950 |
Fact June sales were the highest of the six months, 40% above January.
Possible explanation Two new products launched in April account for most of the increase.
Recommendation Reorder the four low-stock products before the end of the month.
How the service works
- Enquire. Tell us about your business and the questions you want answered.
- Agree the scope. We confirm which files we need, what the report will cover, the timeline and the fee.
- Share your files securely. We agree a secure way to send them. Your data is used only for your project.
- We analyse privately. The analysis runs on our own systems. Your data is not sent to outside AI services.
- Review together. We present the dashboard and report and explain what they show.
This is a managed service: we do the analysis for you. Our analysis workspace is private and is not open for public sign-up or self-service uploads.
Private workspace, used for client projects analytics.emberaiconsult.com
It is not open for public sign-up. We use it to prepare your dashboards and reports as part of a managed service.
Good to know
- We never invent missing figures. If a calculation cannot be done reliably from your data, the report says so and explains why.
- Amounts in different currencies are never added together unless exchange rates are agreed and stated.
- Naira is the default currency; US dollars, pounds, euros, cedis, shillings, rand and CFA francs are also supported.
- Your original files are kept unchanged. Every cleaning step is listed so you can check it.