

Status: In private use by EmberAI for client analysis projects. Public sign-up and self-service uploads are not offered.
The problem
Small and growing businesses usually keep sales, expenses and stock in separate spreadsheets, with inconsistent names, dates and currencies. Combining them by hand is slow and easily produces wrong totals.
Our contribution
We built a private web application that checks each file for quality problems, proposes cleaning steps for approval, suggests how files connect and blocks connections that would count records twice. It then produces dashboards, a branded PDF report and an Excel workbook. It runs on our own systems and does not send data to outside AI services.
What it does
- CSV and Excel uploads, with up to 20 related datasets in one project
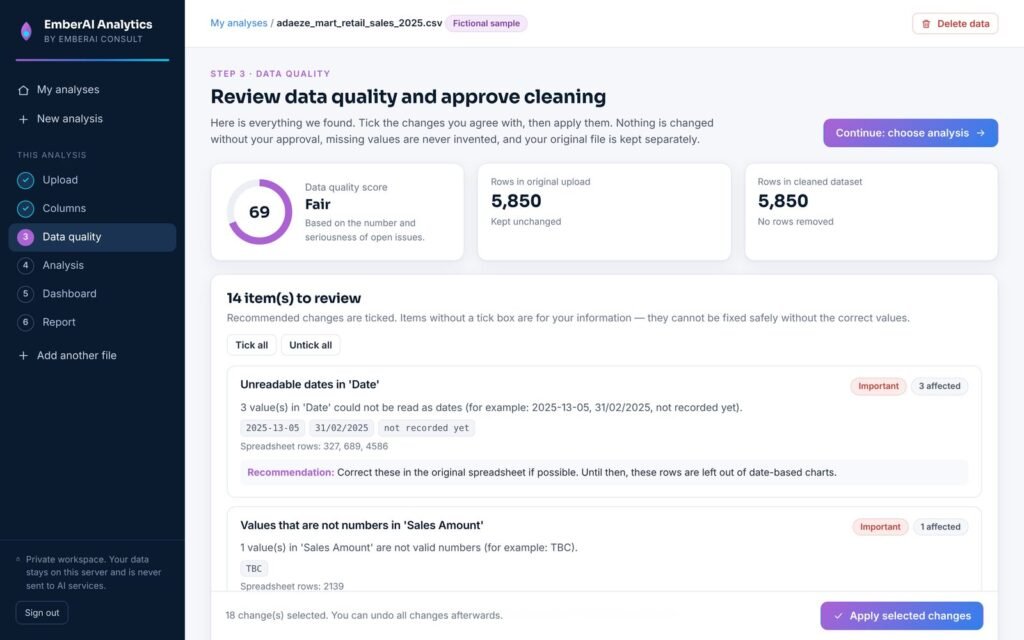
- Data-quality review: duplicates, missing values, mixed date formats, numbers stored as text, mixed currencies
- Cleaning approved step by step, with a full change log and undo
- Suggested connections between files, with checks that prevent double counting
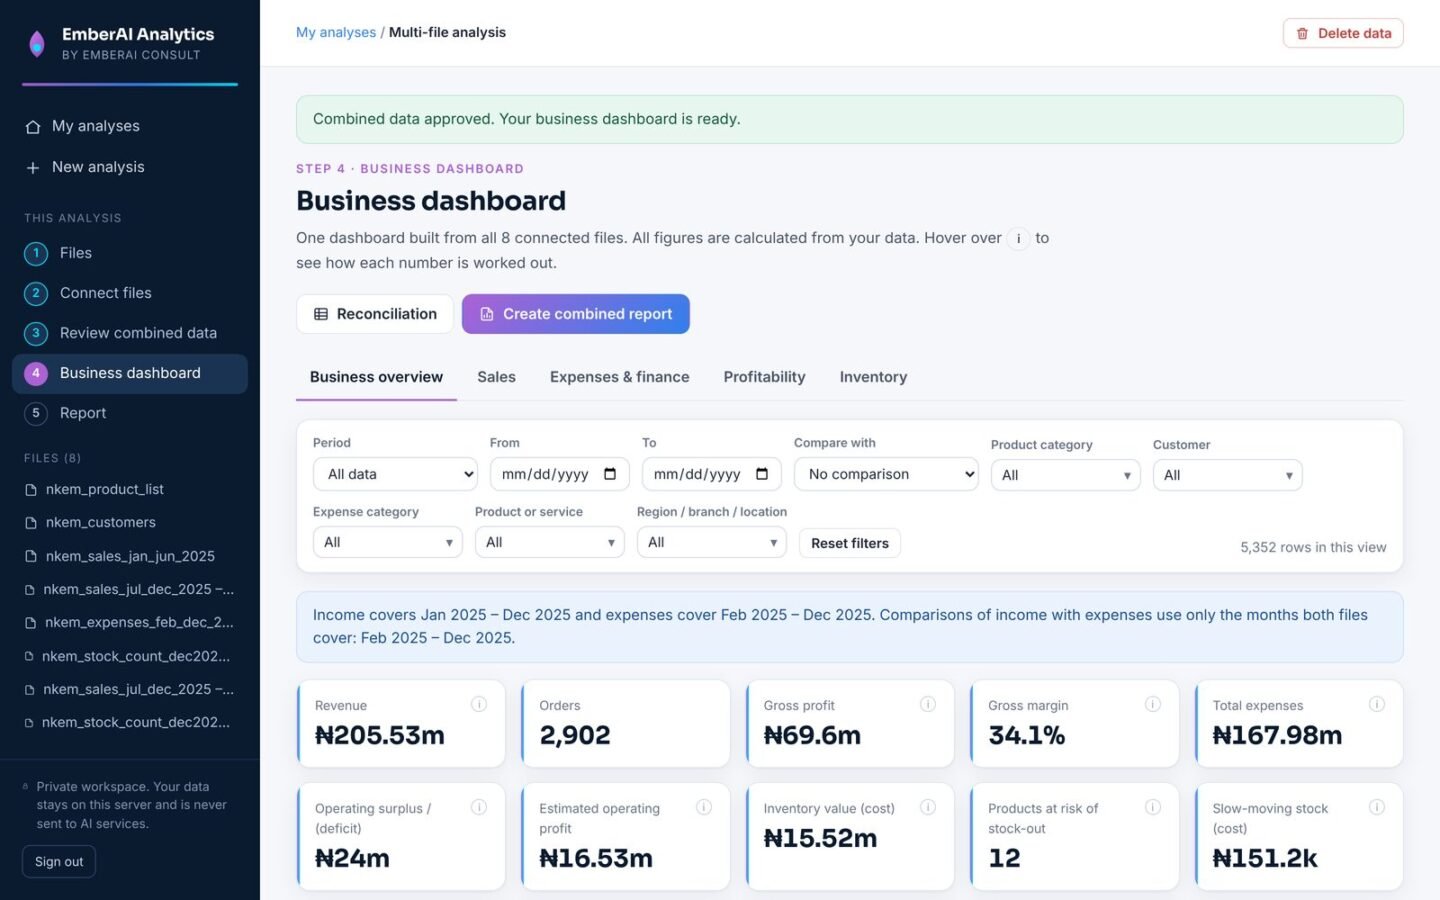
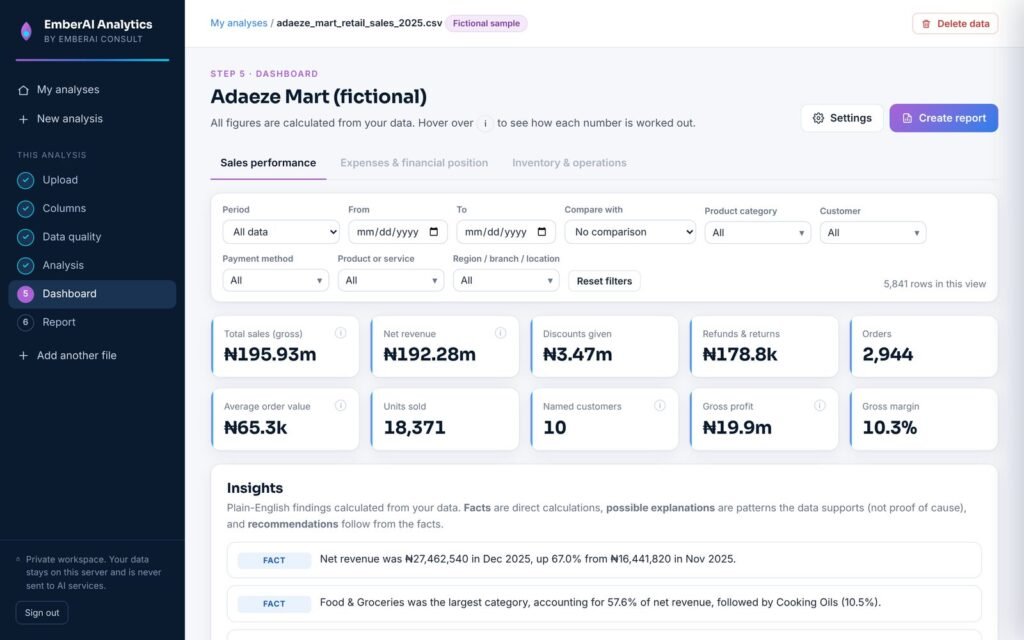
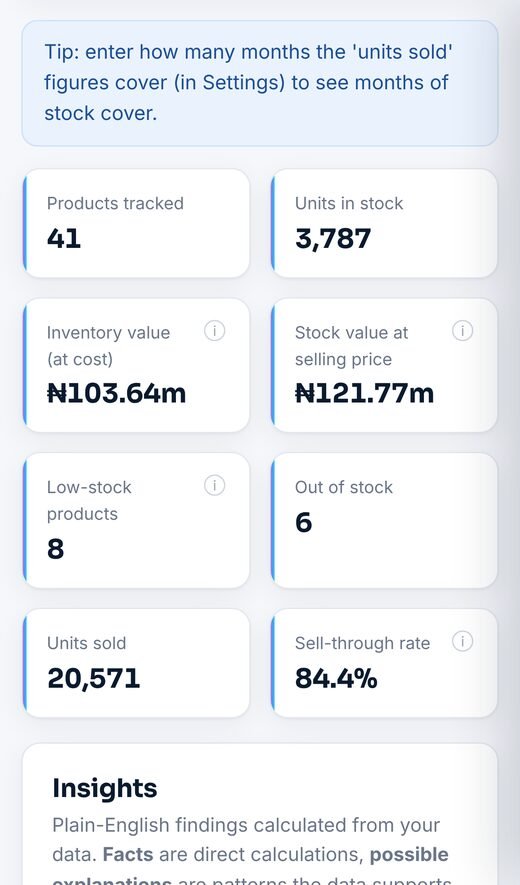
- Business dashboard: overview, sales, expenses, profitability and inventory
- Plain-English insights labelled as facts, possible explanations or recommendations
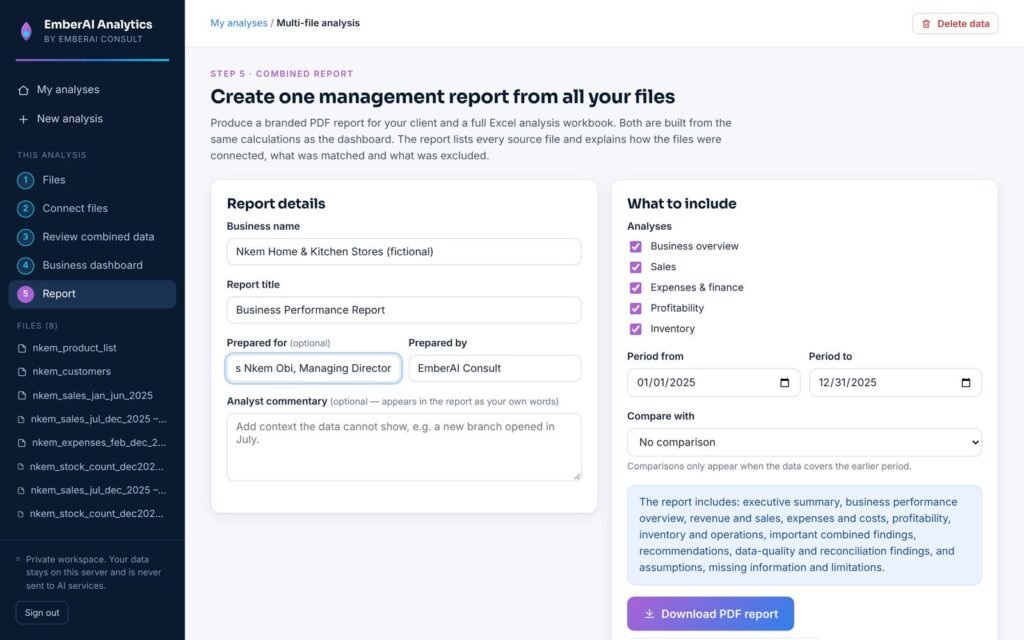
- PDF management report and Excel workbook with native charts
- Naira by default, with seven other currencies supported
Technology: Python Flask pandas ReportLab Chart.js
Screenshots
All screenshots use the fictional sample businesses included with the application.
Read how we use it in our business data analysis service.